Every phase transition obeys a set of rules that are visible but never named. Ice and water coexisted at 0 °C because two thermodynamic functions happened to cross at that temperature and pressure. The temperature plateau during melting persisted because any deviation would have made one phase more favourable than the other, and the system corrected itself instantly. The critical point marked the place where the two curves became indistinguishable and the correction mechanism broke down. All of these behaviours were consequences of a single mathematical object that governs every equilibrium transition in nature: the Gibbs free energy.
The phenomena form a long inventory, from latent heat to the phase diagram of carbon dioxide, from cloud formation to the martensite transformation in steel. Below that inventory lies a layer of quantitative thermodynamics that transforms description into calculation. It develops the thermodynamic machinery that decides which phase wins at any given temperature and pressure, how the decision is encoded in the shape of free-energy surfaces, why first-order transitions involve discontinuous jumps while second-order transitions do not, and how the van der Waals equation provides a concrete, solvable model that predicts phase coexistence, metastability, and the critical point from a single equation of state.
The mathematics here is not ornamental. The Gibbs free energy, the chemical potential, the Maxwell construction, and the Clausius–Clapeyron equation are the quantitative engines that make phase diagrams calculable rather than merely descriptive. Mastering them is what separates someone who can read a phase diagram from someone who can derive one, and from someone who can predict what happens in a system that has never been studied before.
The Gibbs Free Energy and the Criterion for Phase Stability
Internal Energy, Enthalpy, and the Need for a New Potential
The internal energy U of a system is the total energy stored in its microscopic degrees of freedom: the kinetic energy of molecular motion and the potential energy of intermolecular interactions. For an isolated system held at fixed volume and fixed entropy, U is the thermodynamic potential whose minimum determines the equilibrium state. But almost no real experiment is conducted at fixed volume and fixed entropy. Laboratories, kitchens, and atmospheres operate at fixed temperature and fixed pressure, because the system is in thermal contact with its surroundings and exposed to the atmosphere. The thermodynamic potential appropriate for these conditions is the Gibbs free energy.
The construction proceeds in two steps. The first step replaces the entropy constraint with a temperature constraint by introducing the Helmholtz free energy F = U - TS, where T is the temperature and S is the entropy. The Helmholtz free energy is minimised at equilibrium for a system held at constant temperature and constant volume. The subtraction of TS builds in the tendency of the system to increase its entropy: at constant T, a decrease in U and an increase in S both contribute to lowering F, so F captures the competition between energy minimisation and entropy maximisation that dominates all thermal phenomena.
The second step replaces the volume constraint with a pressure constraint by introducing the Gibbs free energy G = F + PV = U - TS + PV, where P is the pressure and V is the volume. Equivalently, G = H - TS, where H = U + PV is the enthalpy, a quantity that accounts for the work the system must do against external pressure when it expands. The Gibbs free energy is minimised at equilibrium for a system held at constant temperature and constant pressure, which is precisely the situation in the vast majority of phase-transition experiments.
The differential form dG = -S dT + V dP + μ dN shows that the natural variables of G are temperature, pressure, and particle number. At fixed T and P, the system will spontaneously evolve in whichever direction decreases G. Of all conceivable states accessible to the system, the one with the lowest Gibbs free energy is the stable equilibrium state. Every phase transition at constant temperature and pressure can therefore be understood as a change in which phase has the lowest G.
The Gibbs Criterion for Phase Equilibrium
When two phases of the same substance coexist in equilibrium, neither phase can be preferred over the other. If one had a lower Gibbs free energy per mole (or per particle), the system would spontaneously convert the higher-G phase into the lower one until only the favoured phase remained. Coexistence therefore demands that the two phases have equal molar Gibbs free energies. This is the Gibbs criterion for phase equilibrium:
where gα and gβ are the molar Gibbs free energies of phases α and β, and the equality must hold simultaneously at the coexistence temperature and pressure.
The molar Gibbs free energy is identical to the chemical potential μ for a pure substance, so the coexistence condition is equivalently μα = μβ. This seemingly simple equation is the foundation of every phase boundary on every phase diagram. The solid-liquid curve, the liquid-gas curve, and the solid-gas curve are each the locus of (T, P) pairs at which the Gibbs criterion is satisfied for the corresponding pair of phases. The triple point is the unique (T, P) at which the Gibbs criterion is satisfied simultaneously for all three pairs.
The power of this framework lies in its generality. It applies not only to the three familiar phases of a simple substance but to any pair of phases in any system: polymorphs of a crystal, magnetic phases of an alloy, superfluid and normal fluid, or the conducting and insulating phases of a Mott insulator. Wherever two thermodynamically distinct states can coexist, the Gibbs criterion is the governing equation.
How the Gibbs Free Energy Determines the Phase Diagram
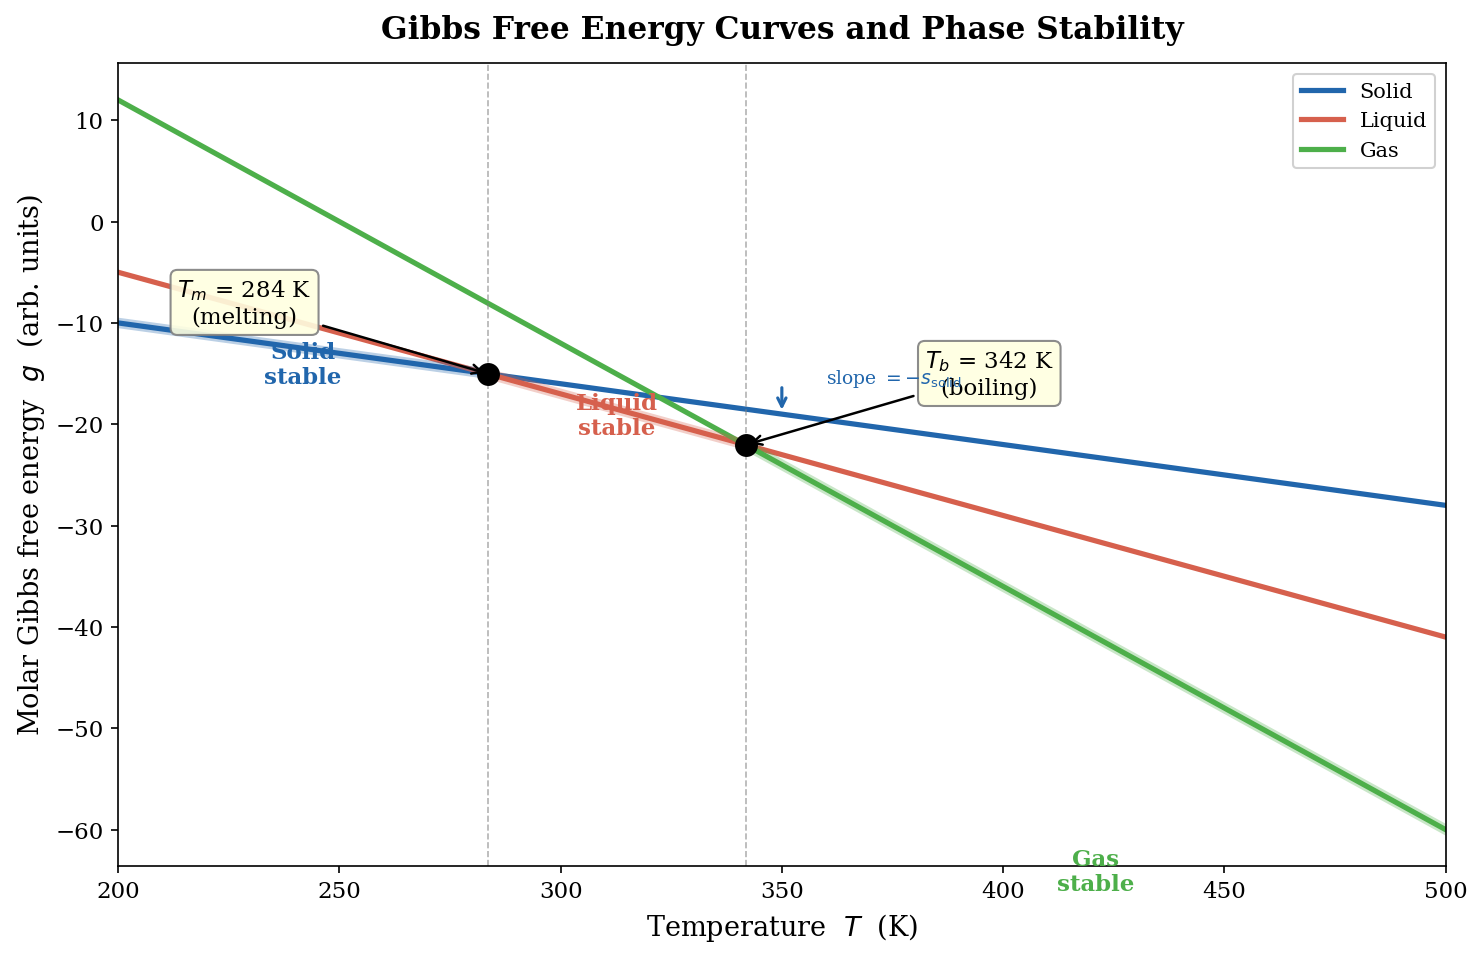
To see how the Gibbs criterion generates a phase diagram, consider plotting g(T) at fixed pressure for two phases of the same substance. Each phase has a curve of g versus T whose slope is (∂g / ∂T)P = -s, where s is the molar entropy. Because the entropy of the gas phase exceeds that of the liquid, and the entropy of the liquid exceeds that of the solid, the g(T) curves slope downward with increasing temperature, and the gas curve has the steepest downward slope. At low temperature, the solid curve lies lowest and the solid is stable. As T increases, the liquid curve, falling more steeply, eventually crosses the solid curve from above. The crossing point is the melting temperature Tm at that pressure. Above Tm, the liquid has lower g and is stable. At still higher temperature, the gas curve crosses the liquid curve at Tb, the boiling point, and the gas becomes stable.
Each crossing of two g(T) curves corresponds to a phase boundary on the P-T phase diagram. Because the slopes are different (the entropies of the two phases differ), the crossing is transversal and the lower curve switches from one phase to the other. The discontinuity in slope at the crossing, Δs = sβ - sα, is related to the latent heat by L = TΔs, recovering the latent heat from the Gibbs free energy framework. The molar volume discontinuity Δv at the transition is obtained from (∂g / ∂P)T = v, completing the connection between the Gibbs surface and the measurable thermodynamic properties of the transition.
This graphical construction also reveals why the critical point exists. As the liquid-gas coexistence curve is followed to higher temperatures and pressures, the two phases become progressively more similar: the liquid density decreases, the gas density increases, the entropy difference shrinks, and the latent heat diminishes. At the critical point, the two g(T) curves become tangent rather than crossing, the entropy and volume discontinuities vanish, and the first-order transition degrades into something different. What replaces it at the critical point is the subject of the second-order transition theory developed later.
Chemical Potential, Clausius–Clapeyron, and the Slope of Phase Boundaries
The Chemical Potential as the Arbiter of Phase Stability
The chemical potential μ is the Gibbs free energy per particle (or per mole, depending on convention). For a pure substance, μ = g, the molar Gibbs free energy, and the coexistence condition gα = gβ is equivalent to μα = μβ. For mixtures, the chemical potential of each component plays the same role: equilibrium between phases requires μiα = μiβ for every species i.
The chemical potential has a vivid physical interpretation. It measures the free-energy cost of adding one more particle (or one more mole) to the system at fixed T and P. If two phases are in contact and μα < μβ, then moving a particle from phase β to phase α lowers the total Gibbs free energy of the system, so the transfer is spontaneous. Particles flow down the chemical potential gradient until μα = μβ and equilibrium is restored.
This picture applies universally. Water evaporates from a lake into the atmosphere until the chemical potential of water in the liquid equals the chemical potential of water vapour in the air above (a condition that defines the equilibrium vapour pressure at that temperature). Ice melts in a glass of warm water because the chemical potential of solid water at the temperature of the water exceeds that of liquid water, driving molecules from the solid into the liquid. A crystal dissolves in a solvent until the chemical potential of the solute in the crystal equals that of the solute in solution, defining the solubility.
The universality of the chemical potential framework means that phase equilibria in systems far more complex than pure water, including multicomponent alloys, polymer solutions, and biological membranes, are all governed by the same underlying principle. The complexity enters through the functional form of μ(T, P, x1, x2, …), which can be elaborate, but the equilibrium condition itself is always the same: equality of chemical potentials.
Deriving the Clausius–Clapeyron Equation from the Gibbs Criterion
The Clausius–Clapeyron equation, introduced earlier as a recipe for the slope of a coexistence curve, can now be derived rigorously from the Gibbs criterion. Along a coexistence curve, the condition gα(T, P) = gβ(T, P) must hold at every point. As we move along the curve by an infinitesimal amount (dT, dP), both gα and gβ change, and the changes must be equal:
Rearranging gives:
where the final step uses L = TΔs, the definition of latent heat in terms of entropy change. This is the Clausius–Clapeyron equation, now derived rather than asserted.
The derivation reveals why the equation is exact and general: it follows directly from the condition that two Gibbs free energy surfaces remain tangent as the coexistence curve is traversed. No approximation has been made, no specific model invoked. The equation applies to any first-order phase boundary in any system, provided Δs and Δv are evaluated at the coexistence conditions.
The equation also makes explicit the connection between the microscopic nature of the transition (captured in Δs and Δv) and the macroscopic geometry of the phase diagram (the slope dP/dT of the coexistence curve). The solid-liquid curve of water has a negative slope because Δv < 0 (ice is less dense than liquid water), while Δs > 0 (the liquid has more entropy). Most other substances have Δv > 0 for melting, and their solid-liquid curves slope positively. The liquid-gas curve always slopes positively because both Δs and Δv are positive (the gas has more entropy and more volume than the liquid).
The Clausius–Clapeyron Equation and the Vapour Pressure of Water
The liquid-gas coexistence curve is the most experimentally important application of the Clausius–Clapeyron equation. For this transition, the volume change is dominated by the gas phase (vgas ≫ vliquid), and if the gas is approximated as ideal (vgas ≈ RT/P), the Clausius–Clapeyron equation simplifies to:
This can be separated and integrated, assuming L is approximately constant over the temperature range of interest:
This is the integrated Clausius–Clapeyron equation. It predicts that a plot of ln P against 1/T should be approximately linear, with a slope that gives the latent heat. Experimental data for the vapour pressure of water, ethanol, and most other substances confirm this linear relationship over wide temperature ranges, providing one of the most direct and elegant measurements of the latent heat of vaporisation.
The integrated equation also shows quantitatively why vapour pressure rises so steeply with temperature. The exponential dependence P ∝ exp(-L/RT) means that even modest temperature changes produce large fractional changes in vapour pressure. For water, the vapour pressure approximately doubles for every 10 °C increase in temperature near room temperature. This steep dependence underlies the practical importance of temperature control in distillation, in the preservation of volatile chemicals, and in the behaviour of the atmosphere (where the Clausius–Clapeyron relation governs the moisture-holding capacity of air and hence the intensity of precipitation events under climate change).
The Van der Waals Equation and the Physics of Liquid-Gas Coexistence
Beyond the Ideal Gas: Why Real Gases Condense
The ideal gas law PV = nRT describes a gas of non-interacting point particles. It works well for dilute gases at high temperature and low pressure, but it cannot explain why gases condense into liquids. A gas described by the ideal gas law would remain a gas at all temperatures, because there is no mechanism in the model for molecules to attract one another and coalesce into a denser phase. To describe the liquid-gas transition, the model must be enriched with two ingredients: intermolecular attraction and molecular volume.
Johannes Diderik van der Waals provided both in 1873, in the equation of state that bears his name. The van der Waals equation modifies the ideal gas law by introducing two parameters, a and b, that capture the effects of intermolecular forces and finite molecular size:
Here Vm is the molar volume, a is a measure of the attractive interaction between molecules (with larger a corresponding to stronger attraction), and b is the volume excluded by the molecules themselves (the effective volume per mole that is unavailable because the molecules have finite size). The term a/Vm2 adds an effective pressure to P because the attractive intermolecular forces act to compress the gas beyond what the external pressure alone would achieve. The term (Vm - b) replaces Vm with the free volume actually available for molecular motion.
The van der Waals equation is not quantitatively precise for real substances; more accurate equations of state (Peng-Robinson, Redlich-Kwong, and many others) have been developed for engineering applications. But the van der Waals equation has an intellectual importance that far exceeds its quantitative accuracy. It is the simplest equation of state that predicts the existence of a liquid phase, a gas phase, a liquid-gas phase transition, a critical point, and the law of corresponding states, all from two parameters and a single algebraic expression. It is, in the language of physics, a minimal model that captures the essential physics of a complex phenomenon.
Isotherms, the Spinodal, and the Maxwell Construction
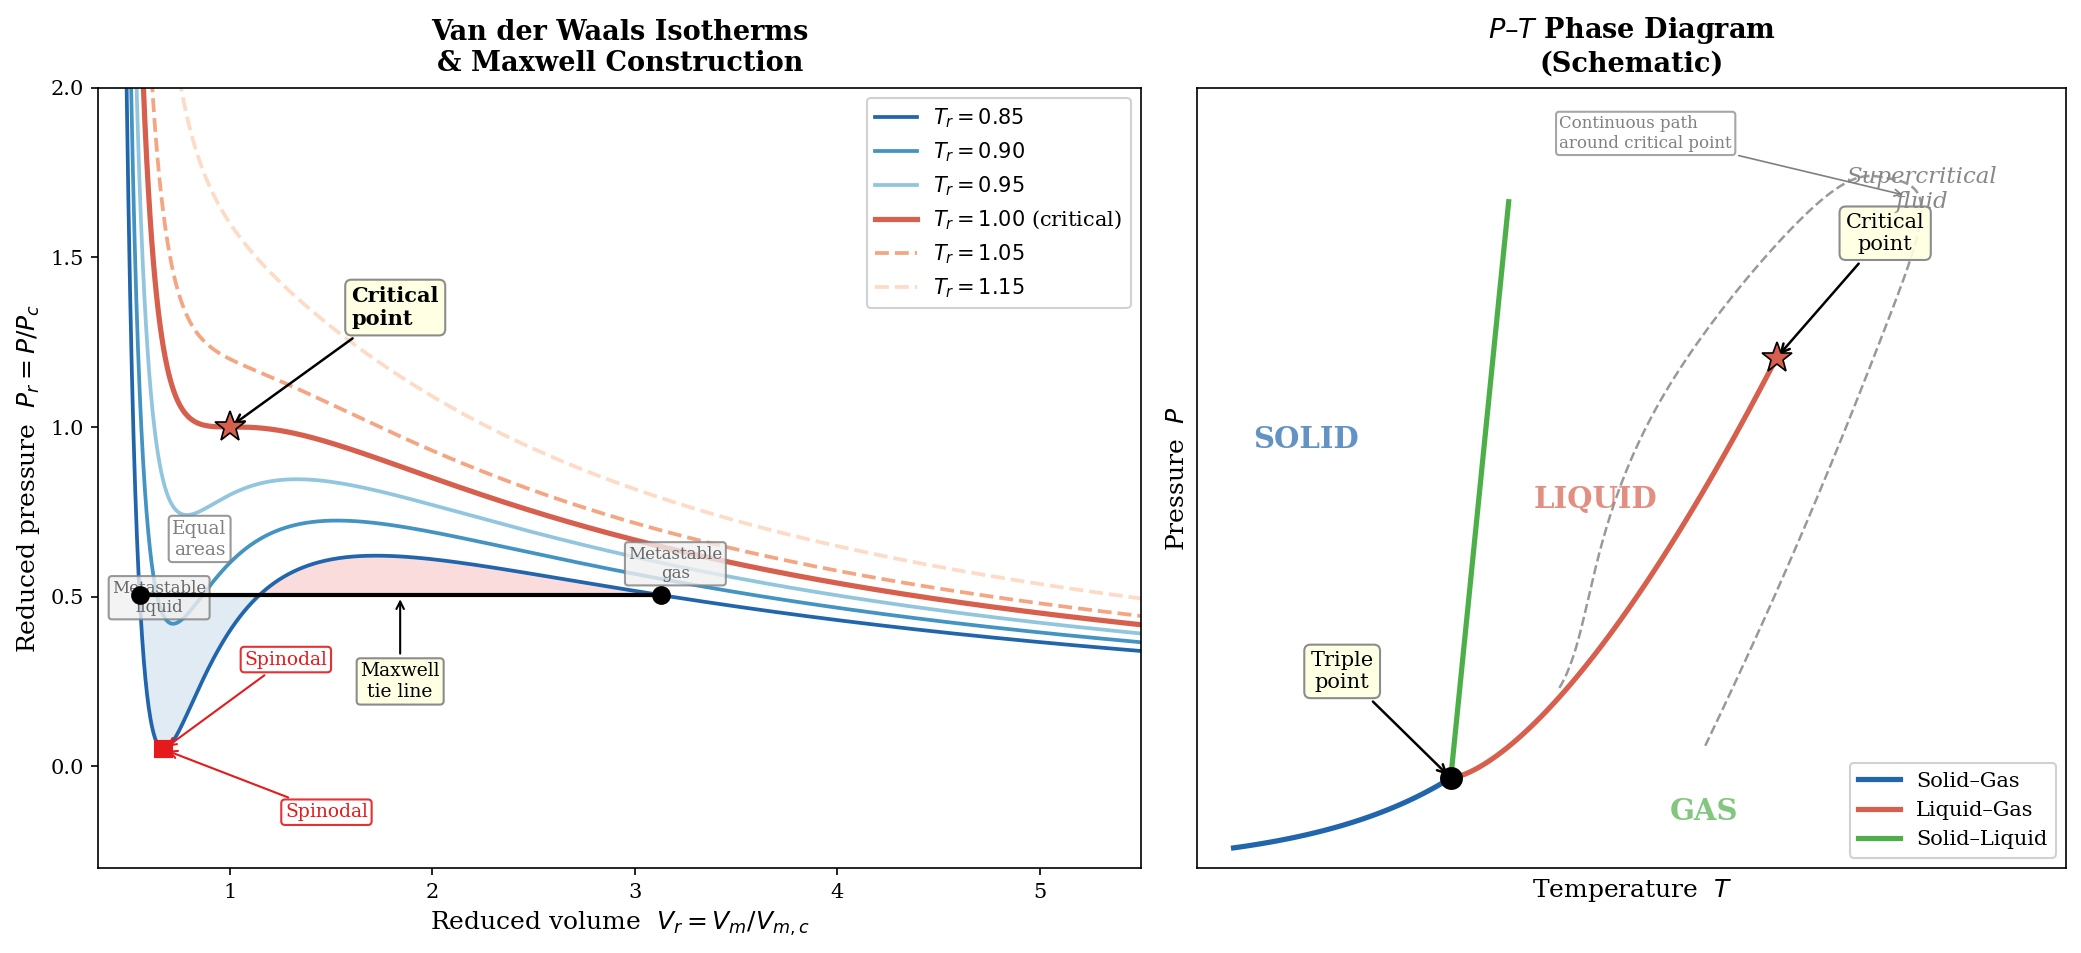
To understand how the van der Waals equation describes phase transitions, consider plotting pressure P as a function of molar volume Vm at constant temperature, producing an isotherm. At high temperatures (well above the critical temperature Tc), the isotherm is a smooth, monotonically decreasing curve: pressure falls as volume increases, just as for an ideal gas. At the critical temperature, the isotherm develops an inflection point where both the first and second derivatives of P with respect to Vm vanish. Below Tc, the isotherm develops a local minimum and a local maximum, creating an S-shaped (or "van der Waals loop") region in which the pressure first decreases, then increases, then decreases again as the volume increases.
The S-shaped region is physically significant but must be interpreted carefully. The portion of the isotherm where (∂P / ∂Vm)T > 0 (pressure increasing with volume at constant temperature) is mechanically unstable: a small compression would lower the pressure, causing further compression, and the system would collapse. The two points on the isotherm where (∂P / ∂Vm)T = 0 define the spinodal curve, which marks the boundary of absolute mechanical instability. Between the two spinodal points, no uniform single-phase state is physically realisable.
But the isotherm outside the spinodal but inside the coexistence region also requires attention. A state on the isotherm between the liquid branch and the spinodal, or between the gas branch and the spinodal, is mechanically stable ((∂P / ∂Vm)T < 0) but thermodynamically metastable: the system can lower its total Gibbs free energy by separating into two coexisting phases (liquid and gas) at the equilibrium pressure. The question of which pressure corresponds to true equilibrium coexistence is answered by the Maxwell construction.
The Maxwell construction, proposed by James Clerk Maxwell in 1875, determines the equilibrium coexistence pressure Peq by requiring that the Gibbs free energies of the two coexisting phases be equal. Graphically, Peq is the pressure at which a horizontal line drawn across the van der Waals isotherm cuts off equal areas above and below the S-shaped curve. This equal-area rule follows from the thermodynamic identity dg = v dP at constant T: integrating along the isotherm from the liquid volume to the gas volume at the equilibrium pressure must give zero net change in g, which requires the two enclosed areas to cancel.
The Maxwell construction transforms the unphysical S-shaped isotherm into a physically meaningful picture. Below Tc, the true equilibrium behaviour is a horizontal tie line at Peq connecting the liquid and gas molar volumes. Along this tie line, the system is a two-phase mixture of liquid and gas coexisting at the equilibrium pressure. The lever rule determines the fraction of each phase present at any point along the tie line, based on the overall molar volume.
The Critical Point from the Van der Waals Equation
The critical point is the temperature and pressure at which the distinction between liquid and gas vanishes. On the van der Waals isotherm, the critical point corresponds to the inflection point where the local minimum and maximum of the S-shaped curve merge. Mathematically, this requires the first and second derivatives of P with respect to Vm to vanish simultaneously:
Solving these two equations simultaneously with the van der Waals equation gives the critical constants in terms of a and b:
These relations have a remarkable consequence. If we define reduced variables Tr = T/Tc, Pr = P/Pc, and Vr = Vm/Vm,c, the van der Waals equation can be rewritten in a universal form that contains no substance-specific parameters:
This is the law of corresponding states: when expressed in reduced variables, all van der Waals fluids obey the same equation of state. The law predicts that the properties of different substances, when compared at the same fraction of their critical temperature, pressure, and volume, should be identical. While not exactly true for real substances (because real intermolecular interactions are more complex than the van der Waals model), the law of corresponding states is approximately obeyed and provides a powerful basis for correlating and predicting the properties of fluids.
Metastability, Superheating, and the Limits of Phase Persistence
Superheating and Supercooling: When Phases Overstay Their Welcome
The thermodynamic criterion for phase stability, encoded in the Gibbs free energy, tells us which phase has the lowest free energy at any given temperature and pressure. But the criterion says nothing about how quickly the system will find the stable phase. A phase that is thermodynamically unstable (that is, a phase whose Gibbs free energy is not the global minimum) can persist for a very long time if there is an energy barrier separating it from the stable phase. Such a phase is metastable: locally stable against small perturbations, but globally unstable.
Superheating is the persistence of a liquid above its equilibrium boiling point. When pure water is heated very carefully in a smooth, clean container (no scratches, no dissolved gas), it can be raised above 100 °C at atmospheric pressure without boiling. The liquid is in a metastable state: its Gibbs free energy is higher than that of the gas, but converting to gas requires the formation of a vapour bubble, which faces an energy barrier related to the surface tension of the liquid-vapour interface. Until a bubble nucleus of sufficient size forms (or a nucleation site is provided), the liquid simply remains liquid at a temperature where the phase diagram says it should be gas.
Supercooling is the converse: the persistence of a liquid below its equilibrium freezing point. Very pure water, free of dust and other nucleation sites, can be cooled to approximately -40 °C before it freezes spontaneously. This extreme supercooling is exploited by some organisms (certain fish, insects, and plants) that produce antifreeze proteins preventing ice nucleation in their tissues. In industrial settings, supercooling is important in the crystallisation of metals, polymers, and pharmaceuticals, where controlling the degree of supercooling determines the crystal size, polymorph, and microstructure of the final product.
The van der Waals framework provides a natural account of metastability. On a subcritical isotherm, the states between the gas spinodal and the Maxwell tie line are metastable gas (superheated gas in the context of condensation, or supersaturated vapour). The states between the liquid spinodal and the tie line are metastable liquid (supercooled liquid or superheated liquid, depending on direction). These states are mechanically stable but thermodynamically metastable, and they persist until nucleation of the competing phase occurs.
The Spinodal and the Absolute Limit of Metastability
The spinodal curve marks the boundary beyond which not even metastability is possible. A state inside the spinodal is mechanically unstable: the condition (∂P / ∂Vm)T > 0 means that any spontaneous compression would drive further compression rather than being resisted, and the system would spontaneously decompose into a mixture of two phases without needing to nucleate a new phase. This process, called spinodal decomposition, is fundamentally different from nucleation in both its mechanism and its kinetics.
In nucleation, the new phase forms as localised droplets or bubbles at specific sites, and the transition proceeds by the growth of these nuclei. The initial steps involve rare, localised fluctuations large enough to overcome the nucleation barrier. Spinodal decomposition, by contrast, involves the amplification of extended, delocalised fluctuations across the entire system. When the system is pushed inside the spinodal (for example, by a rapid temperature quench), composition or density variations at all wavelengths above a certain critical wavelength grow spontaneously, and the system decomposes throughout its volume simultaneously.
The experimental observation of spinodal decomposition is most clearly achieved in binary mixtures (polymer blends, metal alloys, or glass-forming liquids) that are quenched from a single-phase region into the spinodal region of their phase diagram. The resulting microstructure, a characteristic interconnected, labyrinthine pattern of the two phases, is markedly different from the isolated droplets produced by nucleation and growth. This difference in microstructure has practical consequences for the mechanical, optical, and transport properties of the material.
The spinodal limit has been approached experimentally in liquid water by ultrafast laser heating, which can heat a thin layer of liquid faster than nucleation can occur. In such experiments, the liquid reaches temperatures tens of degrees above the normal boiling point before explosive vaporisation occurs, proceeding not through bubble nucleation but through the rapid decomposition characteristic of crossing the spinodal. The practical consequences of superheated metastability range from the inconvenient to the catastrophic. In laboratory settings, bump-boiling occurs when a liquid heated in a smooth glass vessel suddenly erupts into a boiling mass after being raised above its boiling point without nucleation, which is why boiling chips (porous beads providing abundant nucleation sites) are routinely added before heating. On a larger scale, superheated explosions occur when a very hot liquid (such as molten metal or pressurised water) comes into sudden contact with a cooler volatile liquid, heating it far above its boiling point almost instantaneously. The rapid conversion to gas delivers the latent heat as a violent pressure pulse, a mechanism responsible for industrial accidents in foundries, nuclear reactor incidents, and phreatomagmatic volcanic eruptions. Understanding and preventing such explosions relies directly on the thermodynamic theory of metastability and on the distinction between nucleation-limited and spinodal-driven phase change.
Ehrenfest's Original Scheme: Classifying by Discontinuity
Paul Ehrenfest proposed in 1933 a systematic classification of phase transitions based on which derivative of the Gibbs free energy first shows a discontinuity at the transition point. The scheme is elegant in its simplicity. In a first-order transition, the first derivatives of G with respect to its natural variables, specifically the entropy S = -(∂G / ∂T)P and the volume V = (∂G / ∂P)T, are discontinuous at the transition. This discontinuity in S is the latent heat; the discontinuity in V is the volume change. All of the transitions discussed so far that involve latent heat (melting, boiling, sublimation) are first-order in Ehrenfest's classification.
In a second-order transition, the first derivatives of G are continuous (no latent heat, no volume discontinuity), but the second derivatives are discontinuous. The second derivatives of G include the heat capacity at constant pressure CP = -T(∂2 G / ∂T2)P, the isothermal compressibility κT = -(1/V)(∂2 G / ∂P2)T, and the thermal expansion coefficient α = (1/V)(∂2 G / ∂T ∂P). At a second-order transition, one or more of these quantities shows a finite discontinuity (a jump from one finite value to a different finite value) at the transition temperature.
Ehrenfest extended the scheme to arbitrary order: an nth-order transition would have continuous derivatives of G up to order n - 1 and a discontinuity in the nth derivatives. In principle, this hierarchy could continue indefinitely. In practice, third-order and higher transitions are extremely rare (some models of specific magnetic transitions have been proposed as third-order, but the classification becomes contentious).
Beyond Ehrenfest: Divergences, the Modern Classification, and the Ehrenfest Relations
The Ehrenfest classification, while conceptually tidy, encounters a serious difficulty when applied to real second-order phase transitions. Ehrenfest assumed that the second derivatives of G would show a finite discontinuity at a second-order transition: the heat capacity, for instance, would jump from one value to another. But experiments on the lambda transition of superfluid helium, the ferromagnetic transition at the Curie point, and many other continuous transitions show something different: the heat capacity does not merely jump but diverges, approaching infinity as the transition temperature is approached.
The lambda transition of helium-4 at 2.17 K provides the clearest example. The heat capacity, plotted as a function of temperature, forms a shape resembling the Greek letter lambda: it rises to a sharp, apparently infinite peak at the transition temperature Tλ from both above and below. This is not a finite discontinuity in the sense Ehrenfest envisaged; it is a divergence, described by a power law CP ∼ |T - Tλ|-α with a critical exponent α that is small and positive (approximately 0.011 for helium).
The modern classification of phase transitions therefore replaces Ehrenfest's scheme with a simpler binary distinction. A transition is either first-order (there is a latent heat and a discontinuity in the first derivatives of G) or continuous (there is no latent heat, the first derivatives of G are continuous, and the second derivatives typically diverge rather than showing a finite discontinuity). This binary classification is more robust because it does not rely on the specific behaviour of the second derivatives, which varies from system to system and is described by the critical exponents. It also accommodates transitions that resist the Ehrenfest hierarchy entirely, such as the Kosterlitz-Thouless transition in two-dimensional systems, where the correlation length diverges as an essential singularity rather than a power law.
Despite these limitations, Ehrenfest's framework produced relations that remain experimentally useful. By requiring G and its first derivatives to be continuous across a second-order boundary while the second derivatives jump, Ehrenfest derived two equations analogous to the Clausius–Clapeyron equation:
where ΔCP, Δα, and ΔκT are the discontinuities in heat capacity, thermal expansion, and compressibility at the transition. These Ehrenfest relations predict how the transition temperature shifts with pressure, given measurements of the discontinuities in thermodynamic response functions, and they provide useful approximations even for kinetic transitions such as the glass transition in polymers, where the measured jumps in thermal expansion and compressibility at Tg give a reasonable estimate of the pressure dependence of the glass transition temperature.
Surface Tension, Capillarity, and the Energetics of Interfaces
The Origin of Surface Tension at the Molecular Scale
At the boundary between two coexisting phases, molecules experience an environment different from that in the bulk of either phase. A molecule deep inside a liquid is surrounded on all sides by other liquid molecules, and the attractive intermolecular forces are balanced in every direction. A molecule at the liquid-gas interface, however, has liquid neighbours on one side and gas (with far fewer neighbours) on the other. The attractive forces acting on the surface molecule are therefore unbalanced: there is a net inward pull toward the bulk liquid. To remain at the surface, the molecule must resist this inward pull, and the surface as a whole behaves as though it were under tension.
The surface tension γ quantifies this effect. It is the free energy per unit area of the interface, measured in joules per square metre (equivalently, newtons per metre), and it represents the thermodynamic cost of creating interface. Because interface costs energy, the system minimises its total interfacial area at equilibrium, which is why liquid droplets are spherical (the sphere is the shape with the minimum surface area for a given volume) and why small bubbles shrink while large bubbles grow (reducing total interfacial area).
The numerical value of surface tension varies widely between substances and depends on the strength of the intermolecular forces. Water has a surface tension of approximately 72 mN/m at 25 °C, which is unusually high for a non-metallic liquid, reflecting the strength of hydrogen bonding. Liquid mercury, with its metallic bonding, has a surface tension of approximately 485 mN/m. Organic solvents such as ethanol (22 mN/m) and hexane (18 mN/m) have much lower surface tensions because their intermolecular forces (principally van der Waals dispersion forces) are weaker.
Surface tension depends on temperature, decreasing as the temperature rises and vanishing at the critical point. This makes physical sense: as the temperature approaches the critical point, the liquid and gas phases become increasingly similar, the density difference across the interface diminishes, and the energy cost of creating the interface falls to zero. The vanishing of surface tension at the critical point is another manifestation of the disappearance of the phase boundary.
Capillary Rise and the Young–Laplace Equation
The interplay between surface tension and the curvature of interfaces gives rise to capillary phenomena that are important in contexts ranging from the rise of water in plant xylem to the behaviour of ink in a fountain pen nib. The fundamental relationship governing the pressure difference across a curved interface is the Young–Laplace equation:
where R1 and R2 are the two principal radii of curvature of the interface. For a spherical interface (as in a small droplet or bubble), R1 = R2 = R, and the equation simplifies to ΔP = 2γ / R. The pressure inside a small droplet is higher than the pressure outside by an amount that increases as the droplet becomes smaller. This excess pressure is the reason very small droplets are difficult to form and tend to evaporate: the higher internal pressure raises the chemical potential of the liquid, increasing the equilibrium vapour pressure above a curved surface relative to that above a flat surface (the Kelvin effect that governs cloud formation).
Capillary rise occurs when a narrow tube (a capillary) is dipped into a liquid that wets the tube walls. The liquid climbs the tube until the weight of the liquid column balances the upward force exerted by the meniscus at the top. The equilibrium height h is given by Jurin's law:
where θ is the contact angle between the liquid and the tube wall, ρ is the liquid density, g is the gravitational acceleration, and r is the tube radius. For water in a clean glass tube (θ ≈ 0, so cosθ ≈ 1), the rise is inversely proportional to the tube radius. In a tube of radius 0.1 mm, water rises approximately 15 cm, a height that is macroscopically visible and practically significant.
Capillary forces are the mechanism by which water is transported through soil to plant roots and through the xylem vessels of tall trees. The xylem vessels have radii on the order of tens of micrometres, and the capillary effect, combined with the transpiration-driven negative pressure in the leaves, can support water columns tens of metres tall, enabling trees to grow to heights that would otherwise be impossible.
Surface Tension and Nucleation: The Barrier to Phase Change
The connection between surface tension and phase transitions is most direct in the theory of nucleation. When a new phase forms inside an existing one (a vapour bubble inside a superheated liquid, an ice crystal inside supercooled water, a liquid droplet inside supersaturated vapour), the creation of the new phase involves two competing contributions to the free energy: the bulk free energy, which favours the transition (the new phase has lower g than the old), and the surface free energy, which opposes it (creating the interface costs γ per unit area).
For a spherical nucleus of radius r, the total change in Gibbs free energy upon forming the nucleus is:
where Δgv is the bulk free-energy difference per unit volume between the two phases (negative because the transition is thermodynamically favoured) and γ is the surface tension. The first term is negative and grows as r3; the second is positive and grows as r2. For small r, the surface term dominates and ΔG > 0: forming a tiny nucleus costs energy. As r increases, the bulk term eventually wins, and ΔG becomes negative. The maximum of ΔG(r) defines the critical radius r* and the nucleation barrier ΔG*:
A nucleus smaller than r* will shrink spontaneously (it costs more energy to grow). A nucleus larger than r* will grow spontaneously (the bulk free-energy gain now outweighs the surface cost). The nucleation rate, which governs how quickly the phase transition actually proceeds, depends exponentially on the barrier height: J ∝ exp(-ΔG* / kB T). This exponential dependence explains why metastability can persist for very long times: even a moderate nucleation barrier (a few tens of kB T) makes the nucleation rate astronomically slow.
The nucleation barrier decreases as the degree of supersaturation or supercooling increases (because |Δgv| grows), which is why the rate of nucleation rises sharply as the system is driven further from equilibrium. It also decreases at heterogeneous nucleation sites (foreign surfaces, scratches, or dust particles), where the effective surface area of the nucleus is reduced. This is the reason boiling chips work, why clouds require condensation nuclei, and why the controlled crystallisation of pharmaceuticals depends critically on the cleanliness of the crystallisation vessel.
Phase Coexistence, Lever Rule, and the Geometry of Two-Phase Regions
The Lever Rule: Quantifying the Proportions of Coexisting Phases
When a system is within a two-phase region of its phase diagram (for example, a liquid-gas mixture at the boiling point), the overall composition or density of the system is intermediate between those of the two coexisting phases. The lever rule is a simple geometric principle that determines the fraction of each phase present, given the overall composition and the compositions of the two coexisting phases.
Consider a system with overall molar volume Vm that lies on the horizontal tie line connecting the molar volume of the liquid Vml and the molar volume of the gas Vmg at the coexistence pressure. The fraction of the system that is gas, xg, satisfies:
which gives:
This is the lever rule: the fraction of gas is the ratio of the distance from the overall composition to the liquid end of the tie line, divided by the total length of the tie line. The name comes from the analogy with a mechanical lever: the tie line is the lever, the overall composition is the fulcrum, and the masses of the two phases balance the lever.
The lever rule applies to any two-phase coexistence region: liquid-solid, liquid-gas, or solid-solid. In binary phase diagrams (temperature versus composition for a two-component system), it determines the fraction of each phase in a two-phase region and is an indispensable tool in metallurgy, where it tells the materials scientist how much austenite versus ferrite, or how much alpha versus beta phase, is present at a given temperature and composition.
Tie Lines, Binary Phase Diagrams, and the Gibbs Phase Rule
The tie line connecting two coexisting phases on a phase diagram encodes the thermodynamic constraint that the chemical potentials of the two phases are equal. Every point along the tie line represents the same intensive state (temperature, pressure, and the properties of each coexisting phase are the same), but a different overall composition (a different proportion of the two phases). The endpoints of the tie line give the compositions of the coexisting phases, and the lever rule gives the proportions.
In binary phase diagrams, the geometry of tie lines and two-phase regions is more complex and richer. The phase diagram of a two-component system (such as a mixture of two metals, or a polymer in a solvent) is typically plotted as temperature versus composition at fixed pressure. The single-phase regions are separated by two-phase regions, within which horizontal tie lines connect the coexisting compositions. The boundaries of the two-phase region are called the liquidus and solidus curves (for liquid-solid equilibrium), or the binodal curve (for liquid-liquid or liquid-gas equilibrium). The critical point of a binary mixture, called the upper critical solution temperature (UCST) or lower critical solution temperature (LCST), is the point at which the two coexisting compositions become identical and the tie line shrinks to a point. The geometry of binary phase diagrams, including eutectic systems, peritectic systems, and systems with intermediate compounds, is the principal tool of alloy design and materials engineering. The iron-carbon phase diagram, which governs the entire metallurgy of steel, is a binary phase diagram whose features (the austenite field, the eutectoid point at 0.76 wt% carbon and 727 °C, the eutectic between austenite and cementite) directly determine the processing conditions used in every steel mill in the world.
The number of independently variable thermodynamic parameters constraining this geometry is governed by the Gibbs phase rule:
where F is the number of degrees of freedom, C is the number of independent chemical components, and P is the number of coexisting phases. For a single-component system (C = 1), a single phase (P = 1) has F = 2 degrees of freedom: both temperature and pressure can be varied independently without leaving the single-phase region. Two coexisting phases (P = 2) have F = 1: only one variable (say temperature) can be chosen freely, and the other (pressure) is then fixed by the coexistence condition. This is why the coexistence curve is a line in the P-T plane. Three coexisting phases (P = 3) have F = 0: no variable can be changed, and the three phases coexist only at a single point (the triple point).
The phase rule explains why the triple point is invariant (you cannot shift it by changing temperature or pressure), why coexistence curves are one-dimensional in a two-dimensional phase diagram, and why single-phase regions are two-dimensional areas. For multicomponent systems, the phase rule determines the maximum number of phases that can coexist: in a binary system (C = 2), up to four phases can coexist at a point; in a ternary system (C = 3), up to five. These constraints are not arbitrary; they follow from the counting of equations (the equality of chemical potentials across phases) against unknowns (temperature, pressure, and compositions).
The Gibbs phase rule was derived by J. Willard Gibbs in 1876 and is one of the founding results of chemical thermodynamics. Its power lies in its complete generality: it makes no assumptions about the nature of the phases, the form of the interactions, or the equation of state. It is a purely topological constraint on the structure of phase diagrams, valid for any system at equilibrium, and its predictions have been confirmed in systems ranging from simple gases to complex biological membranes.
The quantitative thermodynamic framework developed here, from the Gibbs free energy through the chemical potential, the Clausius–Clapeyron equation, the van der Waals model, and the physics of metastability and nucleation to the lever rule and the phase rule, provides the mathematical machinery that transforms a phenomenological landscape into a predictive science. These tools do not merely describe which phase is stable; they calculate why it is stable, how the phase boundaries are shaped, what happens when the system is pushed beyond equilibrium, and how many degrees of freedom remain when multiple phases coexist.